Best Widgets for Dashboard: Boost With Essential Tools
Data visualization is the core concept of any dashboard. Whether it is monitoring business activity, web analytics, or project development, proper widgets will help turn the dashboard into an efficient source of information to make decisions. In this context, this article will clarify which types of widgets help the end-users keep a hand on the pulse, and how TopperPack may contribute to a better experience, enabling the development of custom solutions that will meet the needs of the clients quickly and efficiently.
What Are Widgets for Dashboards?
In a word, a widget is a small piece of interactive functionality placed on a dashboard. In terms of the diversity of capabilities, from simple to highly customized widgets, is what makes it work. The integration of essential information allows users to interact with the data displayed on the dashboard. Regardless of their design, widgets always serve to display data with specific functionality or permit users to interact with the acquired data on the dashboard.
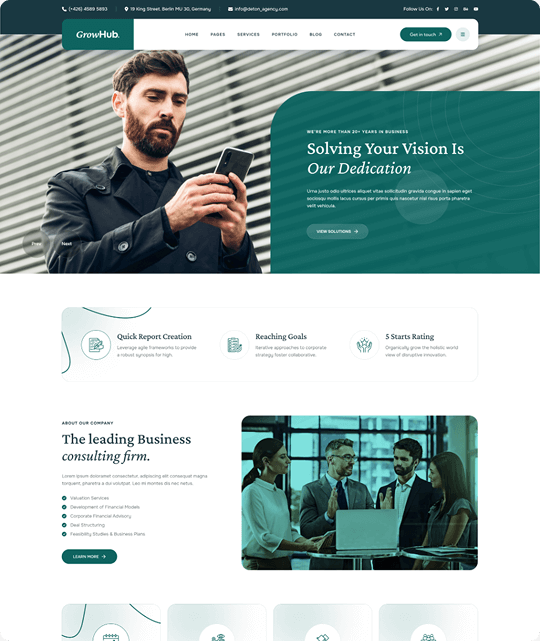
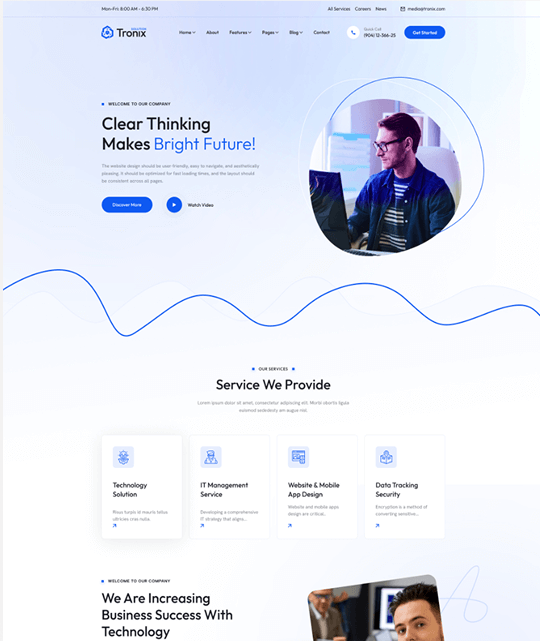
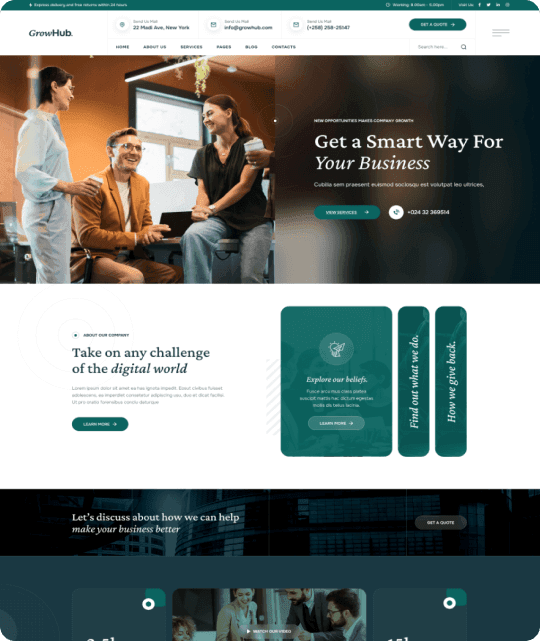
Widgets Help the End-Users Access Knowledge Quickly
Several types of widgets for dashboards will help the end-users acquire data in real-time and make judgments in a matter of seconds. These widgets provide real-time data access and help users stay updated on key metrics or changes in their dashboard environment.
Types of Essential Widgets for Dashboards
Here are some of the most popular widgets for dashboards that improve the user experience:
1. Counter Widget
Description: The Counter Widget shows a live, animated counter that can denote a special countdown or revolving number.
How It Works: This widget is designed to display real-time numbers, which could be a countdown or an ongoing tally, keeping users engaged with up-to-date information. It’s commonly used to track user registrations, work units completed, or revenue streams.
When to Use: Perfect for situations where real-time tracking is important, such as counting users, sales, or other achievements. It’s a great way to display milestones or key performance indicators in a visually appealing way.
2. Progress Bar Widget
Description: A visual indicator for users to see the progress of ongoing tasks. It can appear as a percentage or a colorful bar, providing a clear representation of how much work is completed.
How It Works: This widget adjusts dynamically to show the progress of specific tasks or projects. It can display the completion rate either as a percentage or in a graphical bar format, offering users an easy-to-understand visual of progress.
When to Use: Ideal for tracking project milestones, tasks, or any work that has clear stages or deadlines. Whether it’s a long-term project or a short-term task, this widget helps visualize progress.
3. Advanced Heading Widget
Description: A widget that allows for beautifully designed, flipping subheadings with full adjustable options like color and heading flip effects.
How It Works: You have full control over the design of your headings. With the ability to add animations and custom styling, this widget ensures that your headings stand out on your dashboard, making them both functional and visually appealing.
When to Use: Perfect for creating animated or flipping subheadings, particularly when you want to make a section header more dynamic or interactive on a dashboard.
4. Search Box Widget
Description: The Search Box Widget enables live AJAX search functionality within your dashboard, allowing users to search for specific items or metrics and see results instantly.
How It Works: This widget lets users type queries and see search results in real-time without needing to refresh the page. It retrieves data either from within the dashboard or from external sources, ensuring a smooth and quick navigation experience.
When to Use: Best suited for dashboards with a large volume of data. It significantly improves usability, allowing users to find specific metrics or items with minimal effort.
5. Timeline Widget
Description: This widget arranges information in a timeline format, which can be displayed either vertically or horizontally.
How It Works: Using start and end dates, the Timeline Widget places data along a timeline, providing a clear view of progress and key milestones. It’s a great tool for showcasing historical data or ongoing projects.
When to Use: Ideal for project management dashboards where you need to arrange tasks or events based on timelines. It allows users to schedule and visualize progress over time.
6. Item Box Widget
Description: A visual tool for presenting key metrics or features, typically in a boxed format.
How It Works: This widget groups important data into easy-to-read boxes, allowing you to highlight various metrics or statistics on your dashboard. The layout is highly customizable to focus attention on the most important data.
When to Use: Perfect for dashboards that need to emphasize key data points like KPIs, user activity, or any other metric that requires quick referencing.
7. Custom Carousel Widget
Description: A dynamic set of cards or widgets that rotate from one to another on the dashboard.
How It Works: The Custom Carousel Widget displays a rotating set of items such as images, statistics, or content. You can fully customize the number of items, their display speed, and the content shown.
When to Use: This widget is ideal for displaying news updates, alerts, recent sales, or any type of content that you want to rotate through on your dashboard without taking up too much space.
8. Flip Box Widget
Description: A dynamically flipping content box that displays more information when clicked or hovered over.
How It Works: When users click or hover over the box, it flips to reveal additional information. This interaction is ideal for compact dashboards that require more details without overwhelming the user with too much information upfront.
When to Use: Great for displaying summary information that users can flip over to access more detailed stats. Think of it as a way to keep the dashboard clean while still offering in-depth data when needed.
9. Trade Coin Widget
Description: A widget that provides live cryptocurrency statistics, updating in real-time with the latest market prices.

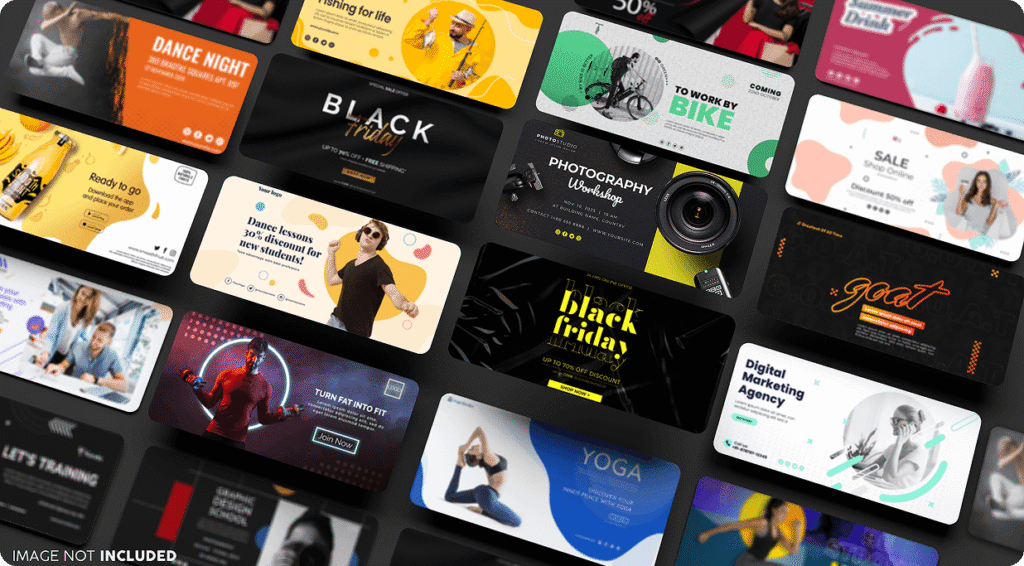
How It Works: This widget pulls live data from cryptocurrency exchanges, updating values to show current market prices for various coins. It’s perfect for traders or anyone who needs to monitor cryptocurrency prices on the go.
When to Use: Best for financial dashboards, crypto trading platforms, or financial professionals who need to stay updated on market trends and price fluctuations in real-time.
Where To Buy The Best Wedges.
If you were hoping to find a one-stop interface for all of these amazing widgets, TopperPack is a godsend. TopperPack is a leading provider of dashboard solutions, offering several widgets for you to choose from to have an ideal dashboard layout for your business. Whether you need real-time data tracking, task management, or performance reports, TopperPack has what you need.
TopperPack has a variety of widgets, including multiple layouts you can choose from, intuitive interfaces, robust integrations, and more. Whatever your dashboard requirements are, TopperPack has you covered. So why not upgrade your dashboard today? The right widgets make all the difference in how you manage and interpret data. Whether it’s real-time tracking, sales performance, or email marketing insights, TopperPack offers a complete set of tools to boost your dashboard’s efficiency.
